
4. Study Design & Sampling
4.1 Introduction
This chapter covers four study design and sampling topics:
1) SRO standards for study design and sampling
2) Mandatory study design and sample selection deliverables for all SRO projects
3) A flow chart to help envision the study design, production sampling,and final documentation process
4) Broad descriptions of the three types of sampling frames most commonly used and the benefits and drawbacks of each frame
SRO Standard Project Procedures
Following are mandatory and conditional study design and sampling deliverables for SRO data collection projects:
 Deliverables
- Study design description and projections of key sampling rates revised since the final proposal;
- A dataset of all interviewed cases, including their answers to the survey questions and final weights;
- Design section in the risk management plan; and
- Technical report.
 Deliverables
All statistical and methodological material can be provided upon request from the client, including:
- Code and output from statistical software;
- Listing materials and files; and
- Methodological experiment analysis and reports.
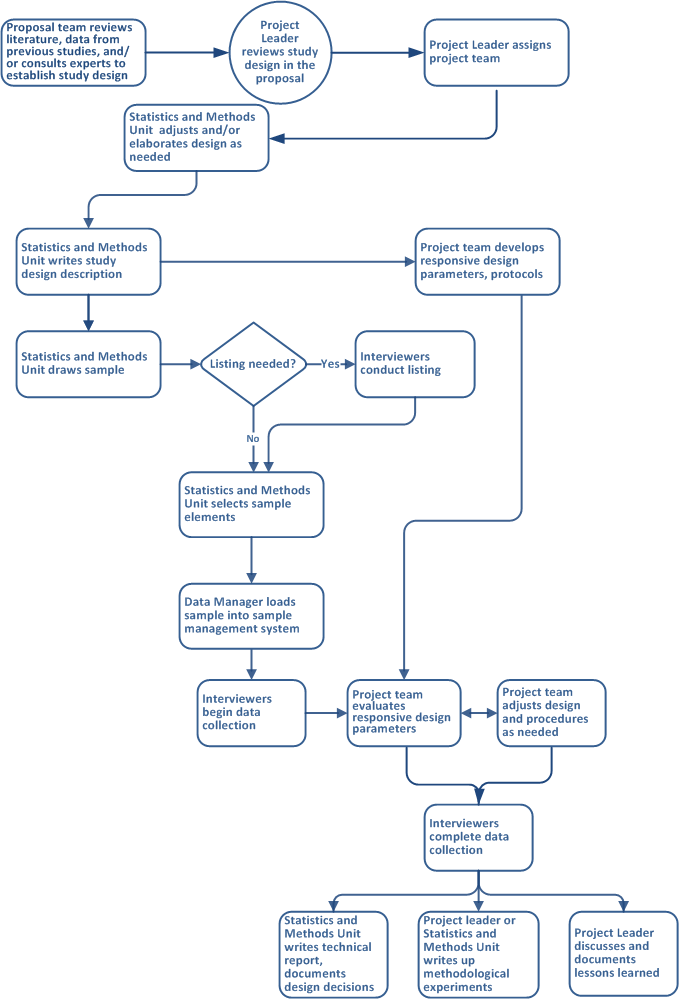
Figure 4.1 provides a diagram of processes for study design and sampling.
Figure 4.1 Processes for Study Design and Sampling
SRC best practices for survey design and sampling are described in Sections 4.2 through 4.6:
- 4.2 Design decisions;
- 4.3 Drawing a sample;
- 4.4 Responsive design;
- 4.5 Methodological experiments; and
- 4.6 Technical report.
The chapter closes with references.
4.2 Design Decisions
The Principal Investigator (PI) is responsible for selecting a study design that is appropriate to the research objectives. The SRO Project Leader assists the PI in assessing the risk of outcomes that are not optimal in the design. The project proposal includes an outline of the design parameters which serves as a starting point for the study design documentation.
The design phase generally includes but is not limited to the following:
4.2.1 Identify project goals
The PI clearly states the purpose and goals of the project.
4.2.2 Review past studies
The Project Leader conducts a literature review, evaluates data from previous studies, and/or consults with members of the Statistical Design Group as appropriate. The Statistical Design Group is comprised of SRC Primary Research Staff from the Survey Methods Program, along with senior SRO staff. Its purpose is to provide consultation on methodological issues faced by projects.
4.2.3 Evaluate cost and benefits
The project team evaluates the costs and benefits of the possible design options.
4.2.4 Identify risks
The project team identifies the most important risks in the selected design and develops alternatives to mitigate or control the risks.
4.2.5 Describe design
The project team writes a study design description that includes the key parameters of the project design and elaborates on how each will be operationalized.
4.2.6 Study design and sample deliverables
The Project Leader lists the study design and sample deliverables, ensuring that the PI understands what variables in the final dataset will (and will not) be provided. This is particularly important for PI’s who do not have an ISR appointment. For more on the delivery of identifying or confidential data, see Chapters 5 and 8 (Information Security and Data Management).
4.3 Drawing a Sample
After the most appropriate design has been determined, the sample is either obtained from the PI or generated by SRO staff. When generated by SRO staff, the sample will be selected from one of three possible frames (or some combination of these), depending on the study design: an existing list of sample units, a Random Digit Dial (RDD) frame of telephone numbers, or an area probability frame of addresses.
4.3.1 Selecting units from an pre-existing list
Existing lists of sample units are typically inexpensive to purchase from a commercial vendor or provided by the PI free of charge [1]. If the sample units (e.g., postal addresses, telephone numbers, email addresses, persons) in the existing list cover the large majority of sample units in the target population of the study, then using the existing list is highly desirable because of its low cost. For example, if a study’s target population is all University of Michigan undergraduates, using an existing list provided by the University is optimal because the list provided by the University should identically match the target population.
For some studies, the target population is not adequately covered by an existing list or such a list does not exist (e.g., 18-35 year old Hispanics in Metro Detroit). In these situations, some commercial vendors can attempt to create a list by purchasing and compiling data from sources such as credit card companies and mortgage lenders. Other commercial vendors can provide online panels of respondents of all ages and race/ethnicities who have agreed to complete surveys over the Internet in exchange for money. Finally, local organizations, such as churches, might be able to provide a list. However, in these situations, the existing lists may not cover a high percentage of the target population and may produce erroneous estimates when inferring back to the target population.
While the exact steps vary depending upon the type of list, the sample desired, and the design of the study, selecting and processing a sample from a pre-existing list may include the following tasks:
- Based on the desired number of completed interviews and best estimates of eligibility and response rates, determine the sample size;
- Obtain a single sampling frame from one source or combine the elements from two or more lists to create a sampling frame;
- Clean and verify the list (e.g., check for duplicates, verify that telephone numbers are working or that businesses are still in operation);
- Stratify and select units (e.g., sample names, addresses, telephone numbers, schools) from the list;
- If the sample units are names or addresses and the list does not include telephone numbers, strongly consider contracting a commercial vendor to match the names/addresses to their master database to obtain telephone numbers. Having multiple modes to contact a respondent generally increases response rates and the cost effectiveness of the study;
- Format the sample file for loading into the sample management system (e.g., assign unique sample ID’s, put fields in specified locations, add variables); and
- Load the sample file into the sample management system.
Example Preload File Structure for Telephone List Sample
Data Dictionary for Address List Sample Provided by Genesys
[1] Note:This section is not addressing respondents in panel studies, where after the first wave of data collection, SRO re-interviews the respondents in successive waves. In follow up waves of a panel study, SRO typically loads the contact information of the respondents (provided by PIs or maintained in the panel study’s “off years” by SRO) into the sample management system and attempts to interview as many of the respondents as possible.
4.3.2 Drawing a Random Digit Dial (RDD) Sample
The list-assisted landline RDD frame and the cell phone RDD frame are unique types of pre-existing frames of telephone numbers. Since the list of landline numbers in the phone book does not include unlisted numbers, it will not cover the target population well if many members of the target population have unlisted landline numbers. On the other hand, selecting a sample of landline numbers from a list of all possible landline numbers is not cost effective; a large number of possible landline numbers are not in service and it would require a massive amount of calling to find a set of working landline numbers.
The list-assisted landline RDD frame strikes a balance between these two extremes. The frame is created by commercial vendors with assistance from landline telephone companies. Each unit on the landline RDD frame is the first eight digits of a landline number, such as 734-647-63xx, where at least one number within that bank of one hundred landline numbers(734-647-6300 to 734-647-6399) is listed in the telephone directory. SRO provides the quantity of landline numbers required in a specific geographic area and the vendor selects that quantity of 100 banks in that geographic area. For each selected one hundred bank, the vendor randomly assigns a number between 00 and 99 to produce the final sample of telephone numbers. This frame and selection procedure is effective because landline telephone companies each own separate banks of one hundred landline numbers and typically like to cluster assigned numbers, both listed and unlisted, into these one hundred banks.
The cellphone RDD frame differs from the list-assisted landline RDDframe since cell phone numbers are not listed. Each potential 100 bank is earmarked as containing only landline numbers, only cell phone numbers or a mix of the two. The cell phone RDD frame consists of all 100 banks which are cell phone only or are a mixed bank that does not contain a listed landline number. In this way, the combination of the list-assisted landline RDD frame and cellphone RDD frame cover all telephone numbers except 100 banks that are assigned as landline only that do not contain a listed landline number.
Creating a RDD sample may include the following tasks:
- Define the geographical area to be covered and other characteristics of the survey population (e.g., are Alaska and Hawaii included?);
- Define stratification (e.g., does the design include oversampling specific groups in the population?);
- Based on the desired number of completed interviews and best estimates of eligibility and response rates from previous SRO studies or survey literature, determine the sample size;
- Input the sample size and sample location information into Virtual Genesys – the user interface for RDD sample selection from SRO’s preferred telephone vendor;
(SRO usually specifies that only working 100 banks with at least one working phone number be included in the sample frame. Genesys uses computer-generated calls to help identify and reduce the non-working telephone numbers.) - When the RDD sample is ready, Genesys will send the person who entered the information into their user interface an email indicating that the sample file is ready for retrieval from their web portal. The sample file is a .txt file of telephone numbers along with demographic Census data regarding each prefix of each telephone number (e.g., 734-647-xxxx);
- If a pre-notification mailing is desired, resend the selected phone numbers to Genesys for address matching;
- Format the sample file for loading into the sample management system (e.g., assign unique sample ID,put fields in specified location, add variables); and
- Load the sample file into the sample management system.
Genesys Landline Sampling Methodology Documentation
Genesys Nonworking Landline Telephone Number Screening Documentation
Genesys Master Address and Telephone Number Database Information
Example Sample Size Determination Spreadsheet for Landline RDD Sample
Example file structure for Landline RDD sample
Data Dictionary for Landline RDD Sample
Example File Structure for Cell Phone RDD Sample
4.3.3 Drawing an Area Probability Sample
When a study wants to do in-person interviews with a random sample of households from the target population and no appropriate pre-existing lists of elements exist, area probability sampling is a viable, though more expensive, option for creating a sampling frame. Area probability methods produce a random sample of households within the geographic boundaries of the target population which can later be screened for study eligibility. They reduce interviewer travel costs by clustering the selected households so that interviewers can visit multiple households in a single trip. Area probability methods cluster households through multiple stages of selection. Below is a brief description of these stages of selection.
At the first stage, a set of large geographic areas (primary sampling units or PSUs) is randomly selected from a comprehensive list of large geographic areas that cover the target population. Next, a set of smaller geographic areas (secondary sampling units, SSUs, or segments) is randomly selected within each selected PSU. Then, interviewers list each household within the selected segments. They send the lists to Ann Arbor, where a random selection of households is made within each segment. Finally, interviewers travel back to the segment to screen the selected households for eligibility for the study.
There are cost and error tradeoffs when deciding between RDD and area probability sampling methods. It is much less expensive to implement RDD methods and collect interviews over the telephone because interviewers do not have to travel to list and screen households or to interview respondents in person. However, area probability methods typically cover the target population better than RDD methods and achieve higher response rates. By increasing coverage and response rates, area probability methods provide greater protection against the potential for bias (the difference between the true value of the target population and the value calculated from the answers from survey respondents).
Creating an area probability sample includes the following steps:
- Define the geographical area to be covered and other characteristics of the survey population (e.g., are Alaska and Hawaii included?);
- Define stratification (e.g., does the design include oversampling specific groups in the population?);
- Based on best estimates of eligibility and response rates, determine the sample size;
- Create a list of primary sampling units (PSUs) based on geographic clusters. In the United States, for example, these clusters are typically Census enumeration areas (e.g., Metropolitan Statistical Area, region, state, and county);
- Determine the optimal number of Primary Sampling Units (PSUs) for the sample (optimization);
- Using a probability sampling method, randomly select PSU’s within each defined stratum;
- Create a list of secondary sampling units (typically called segments) within each selected PSU by again using Census data. Segments are often a Census block or clustered groups of Census blocks. Use census data to select area segments (neighborhood clusters);
- Determine the optimal number of segments for the sample;
- Using the defined stratification, randomly select segments within each selected PSU;
- Travel interviewers to each selected segment to list housing units;
– Usually, trained members of the SRO field staff list addresses on the block; if a list is purchased, it should be checked;
– Maintain a uniform definition of what constitutes a “housing unit;”
– Contact local authorities;
– Scout the segment blocks;
– Update boundaries,streets, and housing unit locations on segment maps;
– List housing units in all blocks (and block-parts) belonging to a segment;
– Provide accurate information on each listed housing unit; and
– Provide accurate information in the segment observation. - After the list has been compiled and checked, select the final, random sample of housing units using a probability method;
- Format the sample file for loading into the sample management system (e.g., assign unique sample ID’s,put fields in specified locations, and add variables);
- Load the sample file into the sample management system;
- During data collection, ask the selected housing units within the PSUs to participate. Once the housing unit has agreed to participate, complete a list of all eligible members within the housing unit; and
- Using a probability method, select one or more eligible members within the housing unit.
– Train the interviewer or, where possible, program the computer to select an eligible respondent based on the selection method specified;
– While some “quasi-probability” and “non-probability”or “quota” within-household selection methods can be used, be aware that such procedures produce a non-probability sample;
– Some studies may want to survey the most knowledgeable adult, the one with primary child care responsibilities, or with some other specific characteristics, rather than randomly select from among the household members. Note that this is part of the definition of the target population and, thus, does not violate probability sampling.
Example Sample Size Determination Spreadsheet for Area Probability Sample
Example Preload File Structure for Area Probability Address List Sample
Eligibility and Sample Design presentation 1-27-03
For more information on SRO sample management systems, see Chapter 6, Systems Development.
Listing Manual
Listing Map Examples
Electronic Listing Program (ELP) Manual
4.4 Responsive Design
Responsive design is encouraged for all SRO projects. Responsive design uses design features and decision rules to optimize the cost-error properties of a survey sample, using pre-existing or empirical data or constraints that accumulate during the course of the data collection period. Responsive design means having a risk management plan that specifies prior to data collection key decision points, key measures, and design options if the project deviates from the project plan. Ideally, decision points and actions to be taken are identified in the project plan. If that is not possible, responsive design involves using the experience and data from the current project to redesign the project if objectives are not being met, or the project can be improved with a redesign. These activities may include, but are not limited to:
- Evaluating data from previous studies to develop projections for key design features, such as hours per interview, eligibility rate, or response rate; and
- Including a design section in the project’s risk management plan that outlines projections for key risk factors, decision points, timeline, and corrective action plans for the most likely outcomes; this risk management plan may include experiments to evaluate how different options might work for this particular study.
4.5 Methodological Experiments
The use of methodological experiments is encouraged where practical, feasible, and desirable. In general, methodological experiments have the greatest chance of being successfully implemented when conceived and agreed upon by the PI and Project Leader during the proposal and pre data collection periods. Thus, if you have an idea for an experiment, work with the proposal group and/or Project Leaders to find a project on which to potentially implement it. The activities involved in implementing a methodological experiment may include, but are not limited to:
- Including experiments as part of the risk management plan to help identify the most effective action to use in later phases of a particular study; and
- Incorporating a new methodological experiment into the design, with the expectation that the results will be published or presented at a conference.
4.6 Technical Report
At the conclusion of every data collection project, the production sampling team will provide a technical report to the project lead for inclusion in the final project report.
4.7 References
Kalton, G., Introduction to Survey Sampling, Volume 35 (available in SRO library).
Groves, R. et. al., Survey Methodology (available in SRO library).
Groves, R., and Heeringa, S. (2006). “Responsive Design for Household Surveys: Tools for Actively Controlling Survey Nonresponse Costs.” Journal of the Royal Statistical Society, 169(3):pp. 439-457.